Track the Metrics That Matter: How to Cut Through Data Overwhelm with the Rule of 4
Amazon sellers have 50+ metrics competing for attention. Here's how to prioritize the KPIs that drive profitable growth, without ignoring the rest.
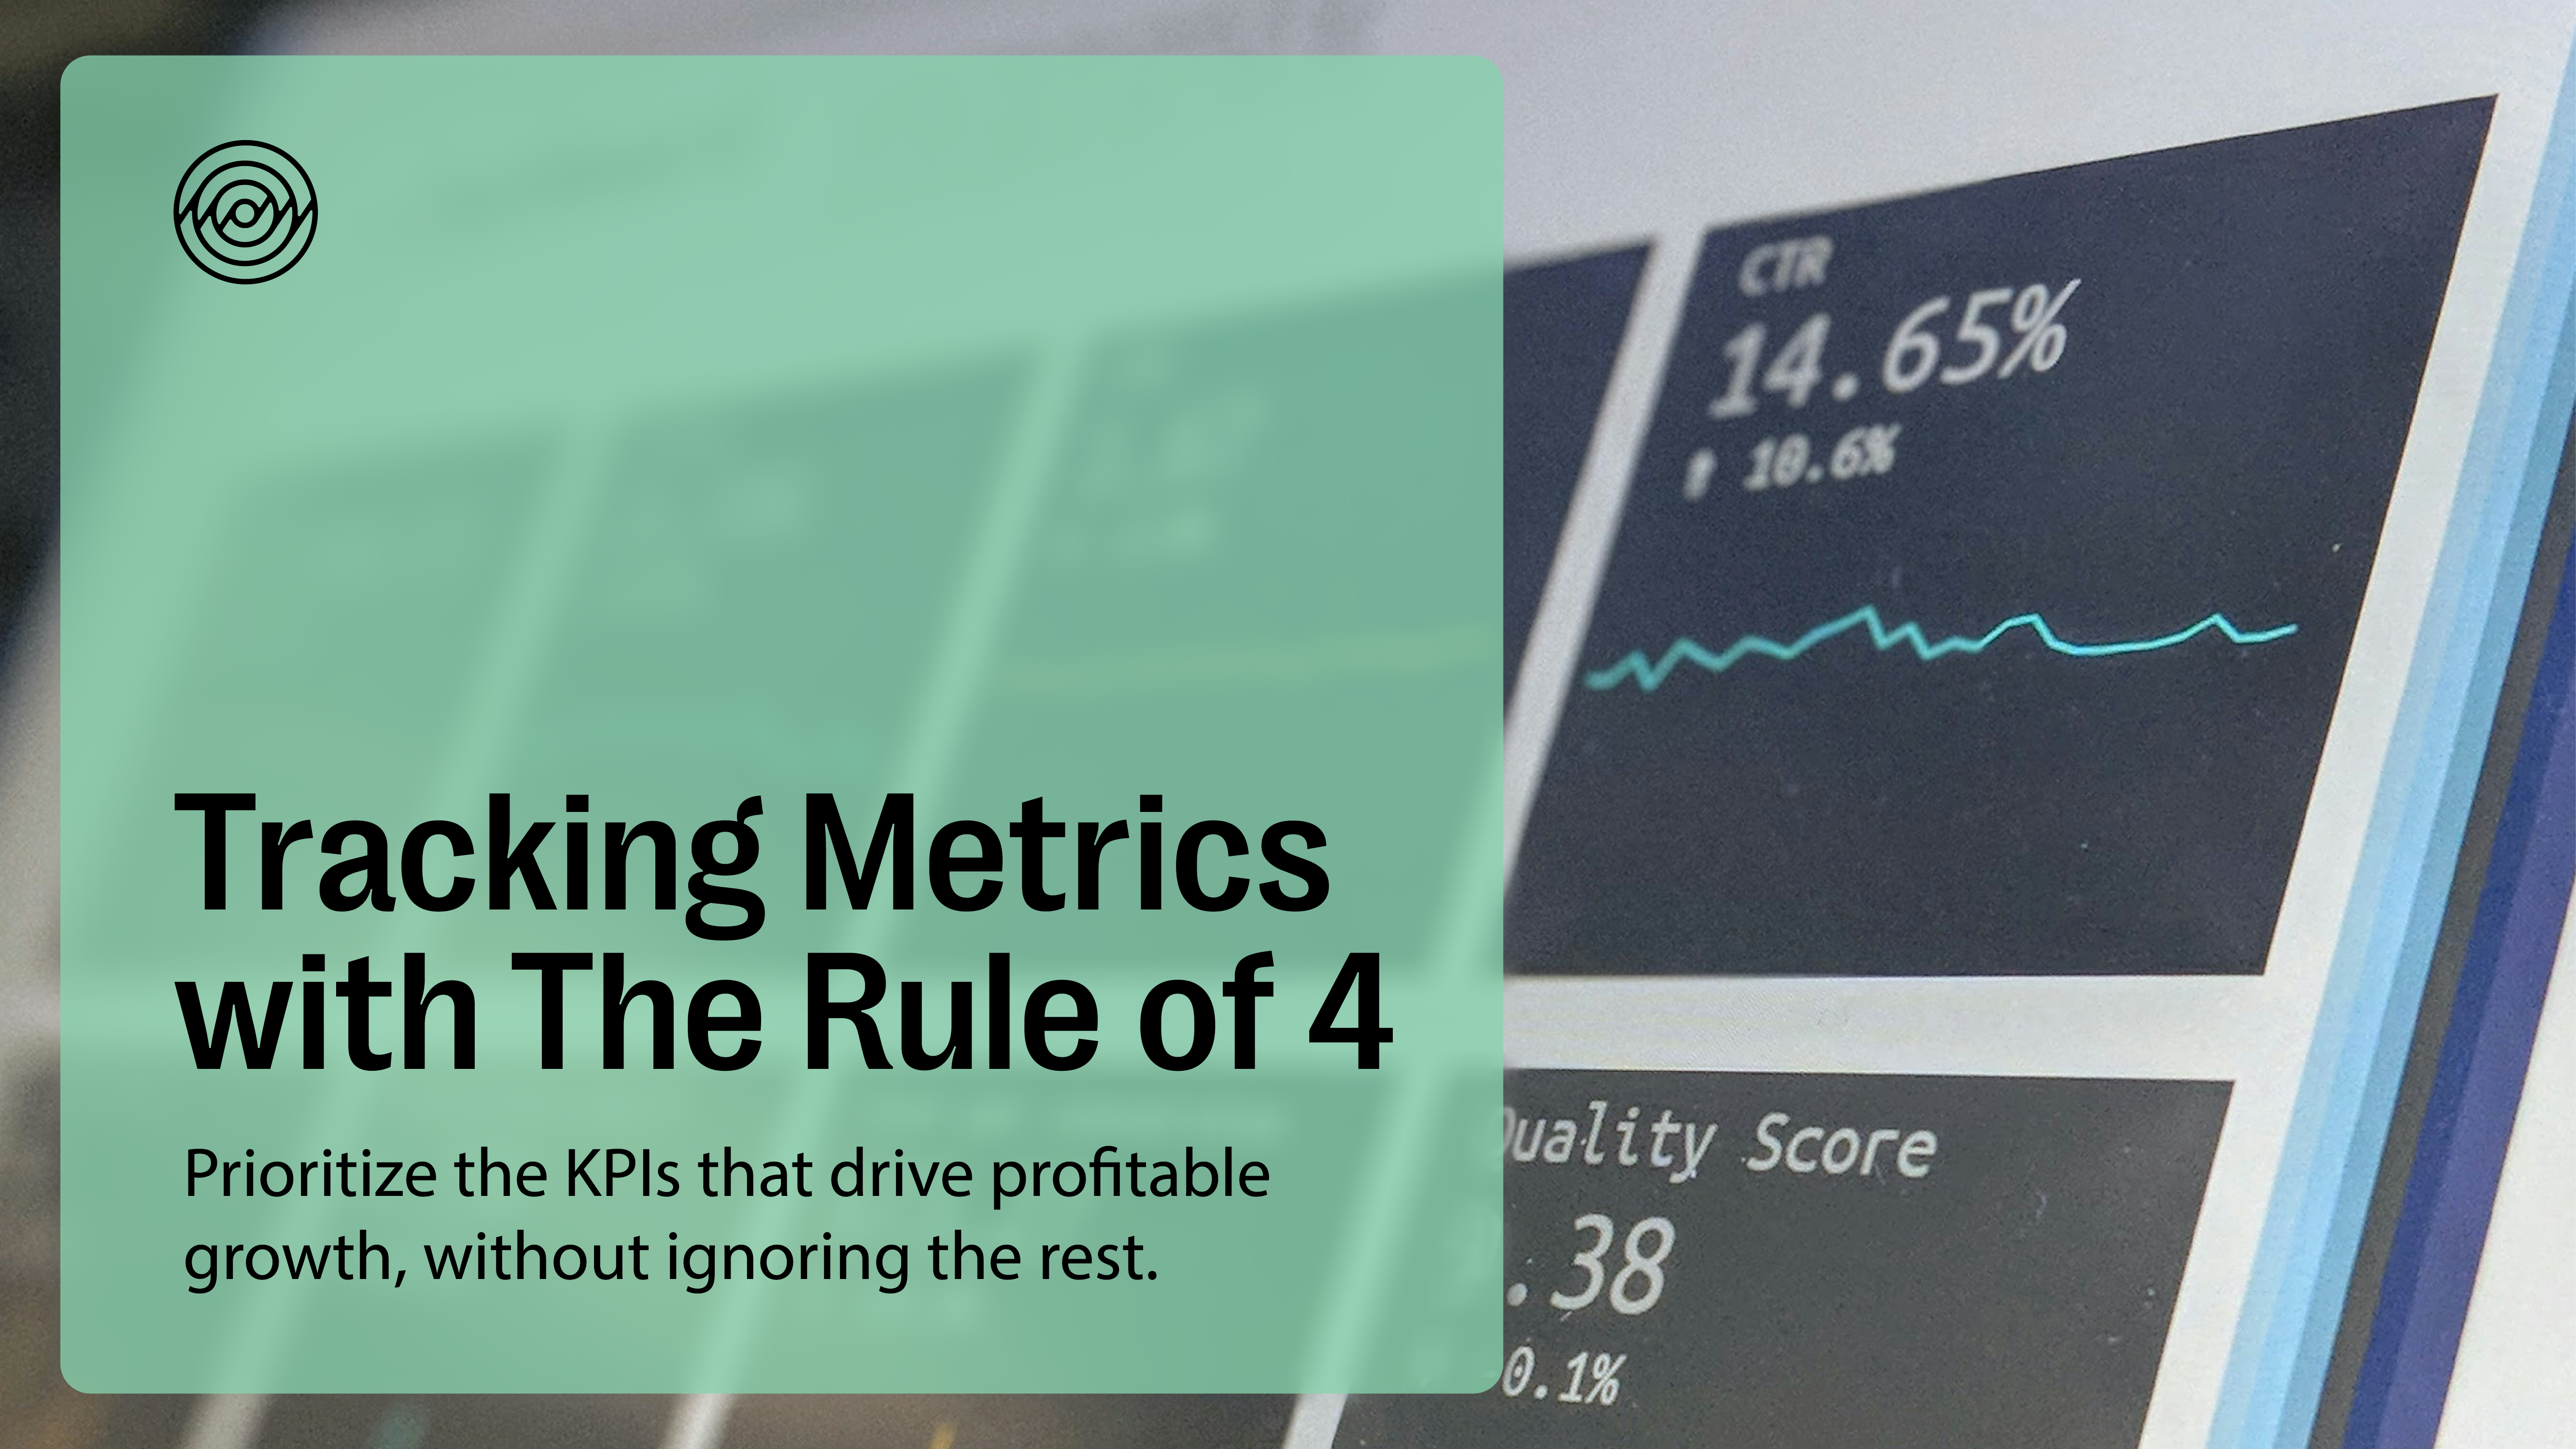
EBITDA (Earnings Before Interest, Taxes, Depreciation, and Amortization). TACoS (Total Advertising Cost of Sales). RoAS (Return on Ad Spend). MROI (Marketing Return on Investment). ACoS (Advertising Cost of Sales). CTR (Click-Through Rate). If your e-commerce metrics dashboard looks like alphabet soup, you're not alone.
The average Amazon seller has access to more than 50 trackable metrics across Seller Central, Brand Analytics, advertising reports, and third-party tools. That volume of data can be a liability if you don't know what to do with it. Creating more dashboards won’t automatically give you more clarity. In fact, we see brands struggling with the opposite: analysis paralysis, conflicting signals, and teams that spend more time reporting on performance than improving it.
TL;DR You don't need every metric. You need the right metrics, tracked consistently, tied directly to a decision you're prepared to make. Here's how to build that system, without losing sight of the data you can't afford to ignore.
Why More Data Isn't the Same as Better Decisions
Ask any operator running a 6- or 7-figure Amazon brand what the most important first step is in building a profitable business, and you'll hear a version of the same answer: know what you're trying to achieve before you go looking for the data to prove it.
That sounds obvious. In practice, most brands do it backward. They pull every report available, build a dashboard with 40 tiles, and then try to reverse-engineer a strategy from whatever looks interesting. The result is a seller who's busy, but not necessarily productive.
Before you touch a single report, answer three questions:
- What's the most efficient way to track my brand's performance without duplicating efforts or needing too many tools?
- How do my operating metrics and financial metrics connect?
- What outcome actually matters to me right now?
Get clear on the outcome first. The metrics you prioritize should work backward from that answer, not forward from whatever report happens to be open.
The Rule of 4: How to Prioritize KPIs Without Ignoring the Rest
Here's the tactic that solves the volume problem directly: the Rule of 4.
Instead of monitoring 50 metrics with equal attention, narrow your core measurement set to four financial inputs and four operational inputs. Everything else becomes secondary; still visible, still worth a glance, but not driving your weekly decisions. This isn't about ignoring data. It's about establishing a hierarchy, so you always know which numbers earn a reaction and which ones are context.
The 4 Financial Metrics
- Sales Growth ($): Your absolute sales increase. This is the clearest signal of momentum and untapped opportunity, and the first place to look when something shifts.
- Contribution Margin (%): SKU-level profitability on organic sales, or what you keep on a sale with zero paid acquisition spend. This is the number that tells you what RoAS you can actually afford on paid campaigns before you erode profit.
- EBITDA (%): Earnings before interest, taxes, depreciation, and amortization, divided by total revenue. Think of this as the overall health metric for your brand's P&L (profit and loss statement).
- Free Cash Flow ($): What's left after covering day-to-day expenses. This is the metric that determines whether you can fund growth, or whether growth is funding itself off a shrinking cushion.
The 4 Operational Metrics
- Traffic (#): Every outcome downstream starts with how many shoppers reach your digital shelf. On Amazon, this shifts constantly with algorithm changes and competitor PPC investment, which is exactly why it needs a consistent baseline.
- Market Share (%): Your percentage of total category sales relative to competitors. This is your clearest read on competitive execution and where future growth is realistically available.
- Trade Spend ($): Total dollars invested in customer acquisition, including advertising and promotions (in short, marketing spend).
- Availability Rate (%): How much inventory is in stock to meet demand. This protects against OOS (out-of-stock) scenarios and keeps your inventory spend efficient. It's foundational to consistency and the customer experience.
Here's the added benefit of building around these eight: many of the metrics sellers obsess over are actually downstream of them. EBITDA, for example, equals Contribution Margin minus ACoS. Once you have a firm grip on contribution margin, you already know exactly how efficient your advertising needs to be to protect profit. You're not ignoring ACoS by focusing on the Rule of 4. You're managing it more precisely, from a metric that controls it.
How to Turn the Rule of 4 Into a Habit
Choosing the metrics is the easy part. Building the discipline to act on them consistently is where most brands lose the thread. A few tactics that keep this practical:
- Set a cadence, and stick to it. Financial metrics (EBITDA, free cash flow) should get a monthly review at minimum. Operational metrics (traffic, availability) move faster and deserve a weekly check. Pick a day of the week and/or month and put a block on your calendar to work through the metrics.
- Assign a threshold to each metric, not just a number to watch. If contribution margin drops below a set percentage, that's your trigger to review pricing or ad spend, not just a data point to note and move past. As your business improves and grows over time, be sure to recalibrate these thresholds.
- Keep secondary metrics visible, but subordinate. CTR, ACoS, and conversion rate still matter. Track them in a supporting view, and only escalate them to your primary review when one of your Rule of 4 metrics moves and you need to diagnose why.
- Revisit your outcome goal every quarter. If you shifted from prioritizing sales growth to prioritizing free cash flow, your entire hierarchy of secondary metrics should shift with it.
Unlock Hidden Insights in Your P&L
Once your Rule of 4 is in place, you're positioned to go one layer deeper. Treat your P&L as a living source of truth, and a few simple calculations will surface insights your standard dashboard won't show you.
Here are three advanced business indicators worth calculating from the inputs you're already tracking:
- Free Cash Flow Conversion Rate: Free Cash Flow ($) divided by EBITDA ($). This shows how much of your EBITDA you're actually pocketing as usable cash. A rate above 1.0 means you have cash on hand to reinvest in marketing, creative, or product development. Below 1.0 signals your EBITDA isn't converting into cash you can deploy elsewhere.
- Contribution Margin Adjusted MROI: Contribution Margin ($) divided by Trade Spend ($). This measures the profit generated for every dollar spent on advertising and marketing, and tells you plainly whether your current strategy is serving the bottom line or just generating top-line noise.
- Gross to Net Bridge: The conversion of gross sales to net sales, after subtracting refunds and promotions. This is your best aggregate read on whether your product is genuinely resonating with shoppers. A low bridge signals inelastic demand at your current price point and low return rates: the early signs of real brand loyalty.
These three calculations turn a static financial statement into a diagnostic tool. You already have the inputs. This is simply asking a sharper question of the same data.
The Bottom Line
Drill down to your brand's actual objective. Deprioritize the data that doesn't serve it. Use the Rule of 4 to build a consistent hierarchy across financial and operational metrics, and use your P&L to unlock the hidden insights sitting inside numbers you're already tracking. That's how you move from reporting on performance to actively driving it.
If you're ready to build a metrics framework tailored to your brand's goals, reach out to the AO2 team today.
Frequently Asked Questions
What are the most important e-commerce metrics to track?
For most Amazon sellers focused on profitable growth, the core set is four financial metrics (sales growth, contribution margin, EBITDA, and free cash flow) and four operational metrics (traffic, market share, trade spend, and availability rate). Together, these eight form a hierarchy that other metrics, like ACoS or CTR, roll up into.
How many KPIs should a brand track?
Fewer than most sellers assume. While more than 50 metrics are technically available across Seller Central and advertising platforms, the Rule of 4 narrows your primary tracking set to eight: four financial, four operational. Secondary metrics still matter, but they should support, not compete with, this core set.
What's the difference between operational and financial metrics?
Operational metrics (traffic, market share, trade spend, availability rate) measure the activity driving your business day to day. Financial metrics (sales growth, contribution margin, EBITDA, free cash flow) measure the outcome of that activity in dollars and percentages. The two connect directly: your operational inputs are the levers, and your financial metrics show whether pulling them is working.
How does EBITDA relate to ACoS?
EBITDA (%) is a function of Contribution Margin minus ACoS. If you understand your contribution margin and its drivers, you already know how efficient your advertising needs to be to protect profitability, without needing to track ACoS as a standalone priority.
What is a good Free Cash Flow Conversion Rate?
Anything above 1.0 means you're converting a strong share of your EBITDA into usable cash, giving you room to reinvest in growth. A rate below 1.0 signals your EBITDA isn't translating into cash you can deploy elsewhere, even if your profitability on paper looks healthy.
Latest Updates


Curious what AO2 can do for your brand? Schedule a call today.
.svg)


.webp)